Trends in Peak Fall Leaf Color Timing
Trends in the Timing of Peak Fall Leaf Color in the Southern Appalachians and What Causes Them
Over the nearly 20 years that I have been monitoring fall leaf colors I have sensed that the timing of peak fall leaf color is delayed if the latter half of September and the first half of October are warmer than usual. In 2018 and 2019 we had exceptional warming and peak colors were delayed by 1 and 2 weeks, respectively, the most I have seen in my two decades of following fall leaf color.
So, to satisfy my curiosity about how the timing of peak color has varied over the past two decades, I embarked on a statistical journey to quantify this and to determine if there is any trend over time. I went back over my Facebook postings and picked out the week that I declared colors were at their peak. Now, I should clarify this. The peak times are for the Boone to Grandfather region at an average elevation of 3300’. Further, peak color is a subjective opinion on my part of colors presented on the landscape and not any detailed analysis of species-specific color peaks. Rather, it is the conglomeration of all the trees that I am talking about.
The question that I wanted to answer was whether there were any trends at all, because it is easy to think there might be if even just one year occurs late. So, I plotted the timing of peak leaf color based on my weekly reports over the past 18 years in the graph below. On a second graph I plotted the mid-point of peak color week against year. With regard to the first graph, the colored boxes depict the 95% confidence interval (CI) for the date of peak color. For the years 2008 to 2016 the interval ranges from October 12 to October 16 while for the years 2017 to 2025 that interval ranges from October 16 to October 20.
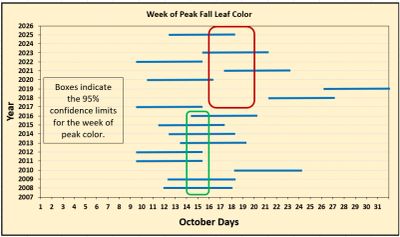
The way you interpret a 95% CI is as follows: if any portion of a horizontal blue bar is not within a colored box, then it is significantly different from the long-term average. In this case, for the years 2008 to 2016, only one year (2010) fails to have any portion of its bar in the green box, which means peak color occurred significantly later than in all the other years. Since all the other years had a portion of their bars in the 95% CI box, they cannot be considered to differ statistically in timing from each other. In other words, peak leaf colors occurred between October 12 and 16 for 8 out of these 9 years.
The red box is the 95% CI for the years 2017 to 2025 (2024 is excluded because of Hurricane Helene). In this case, note that the interval is shifted to the right and ranges from October 16 to October 20. You can easily see that there appears to be greater variation in the timing of peak color in these years. In fact, if you calculate the variance in timing (a measure of how different the timing is from year to year), it is over four times than for 2008 to 2016 (38.1 vs 9.0, days2, respectively). Note: variance has units that are the square of the original ones.
Despite this large difference in variance between the two groups of years, it is only marginally significant (p = .060) from a statistical perspective. For those not into statistics, the difference is only statistically valid if the p value is equal to or lower than 0.05. In this case, 0.06 is close to but not less than the critical level of .05. To be honest then, I can’t say with a high degree of certainty that the difference in variability occurred because of warming. Rather, it could simply be due to chance.
But in this case, I think 0.06 is close enough to 0.05 to raise my suspicions. For example, half of the 8 years between 2017 and 2025 were outside the 95% CI box (two were early, two were much later). Remember, for the years before 2017, only one out of 9 years was outside the 95% CI box.
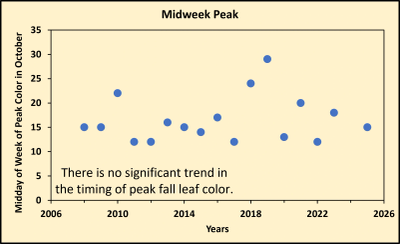
But looks can be deceiving! My two groups were arbitrarily divided into two nearly even groups of years, which introduces some bias on my part. To see whether the date for peak color really is really happening later I plotted those data against year and ran a regression to see what pattern could be observed.
A regression assumes that the timing of peak color depends on the year in which it occurs. If the slope, which is the change in timing divided by the change in years (days/year) is different from zero, then we can conclude that there is a trend in timing with years.
But when I plot the data, I find no relationship between timing and year (see graph below). That is, year does not explain the variation in timing of peak color. In fact, the slope of the line that goes through the points is zero, meaning that it has not changed at all since 2008. The regression only explains 2% of the variation in peak color timing, meaning that other factors not accounted for determine peak timing (98% of the variation in fact!).
Since years themselves did not explain the variation in timing, I obtained the daily mean temperatures for the months of August, September, and October for every year from 2008 to 2025. Daily mean temperature is simply the average of the high and low temperatures for each day and then averaged across the entire month. I also obtained data for just the latter halves of August and September, and the first half of October.
I then entered those data into the statistical program Minitab and constructed regressions using data from each month or half month to determine if temperature was determinant of peak color timing. And voila! There was! The best regression was when used the mean temperature for September. This regression explained 62% of the variation in timing, which for field data, is very good. A close second was just the latter half of September which explained 60% of the variation. Data from August and October had poor fits, explaining no more than 32% at most. So, this confirms what I’ve been saying now for nearly two decades – that September temperatures influence peak color timing the most.
Below is the regression of peak leaf color timing versus September mean daily temperature. The two highest data points are the years 2018 and 2019 and they strongly drive this significant relationship. If, for example, you remove those two years and redo the regression, the amount of variation explained declines to just 25% and the relationship is no longer significant (p = .056). Close, but no cigar.
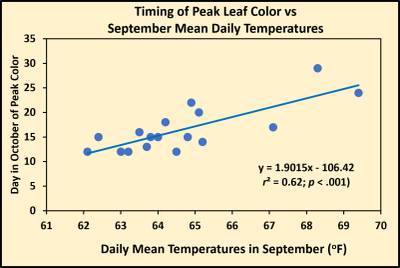
The slope of the graph above is 1.90 which means that for every 1oF increase in mean daily September temperature, peak leaf color is delayed by nearly 2 days. Since 2008, September temperatures have varied from a low of 62.1oF in 2012 to a high of 69.4oF in 2018. The long-term average is 64.7oF. So, in 2018, temperatures were 5.2oF above the average, which should mean that peak colors would be delayed by ~10 days. In fact, peak colors were delayed almost 8 days that year, which is not that far off what was predicted.
If we consider the years 2018 and 2019 anomalous and not part of a trend, and then redo the regression without them, it turns out that the relationship is no longer significant, although it is close (p = .056). This suggests that September temperatures are still important, but we should proceed with caution.
Now remember, these patterns are for leaf colors in the 2,500’ to 4,000’ elevational range. For forests above this elevation, colors will peak sooner, and below, later.
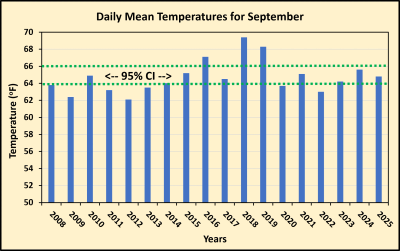
Lastly, I plotted mean daily September values by year to see if this month is showing any signs of warming over the past two decades. I also did this for Aug and Oct, and for all three months there were absolutely no trends with time (see graph below). That is, there is no evidence that over the past 18 years that these three months have been warming.